| |
 |
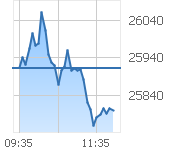
Hang Seng Index |
23055.03 |
0.00 |
0.00% |
32.110M |
951.709M |
|
| |
|
 |
|
Previous Close |
23055.03 |
|
Open |
0.00 |
|
Turnover |
951.709M |
|
| |
High |
0.00 |
|
Low |
0.00 |
|
Volume |
32.110M |
|
| |
One Month |
-861.03
(-3.60%)
|
22518.00 / 25953.01 |
| |
Two Months |
-851.94
(-3.56%)
|
23272.75 / 25735.89 |
|
Last:
23055.03
|
|
Three Months |
+550.35
(+2.45%)
|
22449.16 / 25735.89 |
|
0.00
(0.00%)
|
|
52Weeks |
+6356.67
(+38.07%)
|
22518.00 / 28056.10 |
|
|
| |
|
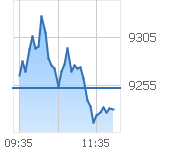
China Enterprises |
7612.48 |
0.00 |
0.00% |
10.031M |
0 |
|
| |
|
 |
|
Previous Close |
7612.48 |
|
Open |
0.00 |
|
Turnover |
0 |
|
| |
High |
0.00 |
|
Low |
0.00 |
|
Volume |
10.031M |
|
| |
One Month |
-996.79
(-11.58%)
|
7404.47 / 8723.61 |
| |
Two Months |
-1072.25
(-12.35%)
|
8429.46 / 9295.86 |
|
Last:
7612.48
|
|
Three Months |
-618.56
(-7.51%)
|
8165.28 / 9295.86 |
|
0.00
(0.00%)
|
|
52Weeks |
+1735.84
(+29.54%)
|
7404.47 / 9770.21 |
|
|
| |
|
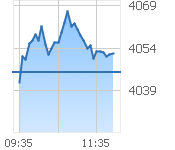
China-Affiliated Corps |
3735.60 |
0.00 |
0.00% |
123.447K |
0 |
|
| |
|
 |
|
Previous Close |
3735.60 |
|
Open |
0.00 |
|
Turnover |
0 |
|
| |
High |
0.00 |
|
Low |
0.00 |
|
Volume |
123.447K |
|
| |
One Month |
-358.12
(-8.75%)
|
3652.68 / 4472.22 |
| |
Two Months |
-303.39
(-7.51%)
|
4003.74 / 4391.60 |
|
Last:
3735.60
|
|
Three Months |
-52.46
(-1.38%)
|
3761.10 / 4391.60 |
|
0.00
(0.00%)
|
|
52Weeks |
+271.95
(+7.85%)
|
3652.68 / 4669.16 |
|
|
| |
|
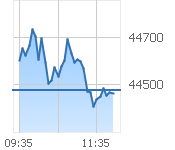
HSI Finance |
49789.77 |
0.00 |
0.00% |
9.006M |
0 |
|
| |
|
 |
|
Previous Close |
49789.77 |
|
Open |
0.00 |
|
Turnover |
0 |
|
| |
High |
0.00 |
|
Low |
0.00 |
|
Volume |
9.006M |
|
| |
One Month |
+6203.01
(+14.23%)
|
49130.88 / 53455.73 |
| |
Two Months |
+8093.78
(+19.41%)
|
41442.81 / 46323.34 |
|
Last:
49789.77
|
|
Three Months |
+11988.31
(+31.71%)
|
37950.41 / 46323.34 |
|
0.00
(0.00%)
|
|
52Weeks |
+20852.04
(+72.06%)
|
43205.68 / 54727.04 |
|
|
| |
|
HSI Utilities |
35961.28 |
0.00 |
0.00% |
1.005M |
0 |
|
| |
|
 |
|
Previous Close |
35961.28 |
|
Open |
0.00 |
|
Turnover |
0 |
|
| |
High |
0.00 |
|
Low |
0.00 |
|
Volume |
1.005M |
|
| |
One Month |
-404.91
(-1.11%)
|
36144.44 / 38992.98 |
| |
Two Months |
-1202.86
(-3.24%)
|
35768.22 / 37802.71 |
|
Last:
35961.28
|
|
Three Months |
-558.67
(-1.53%)
|
35768.22 / 37802.71 |
|
0.00
(0.00%)
|
|
52Weeks |
+262.10
(+0.73%)
|
35365.68 / 41657.84 |
|
|
| |
|
HSI Properties |
18534.80 |
0.00 |
0.00% |
2387 |
0 |
|
| |
|
 |
|
Previous Close |
18534.80 |
|
Open |
0.00 |
|
Turnover |
0 |
|
| |
High |
0.00 |
|
Low |
0.00 |
|
Volume |
2387 |
|
| |
One Month |
+562.48
(+3.13%)
|
18142.05 / 21091.27 |
| |
Two Months |
+1767.18
(+10.54%)
|
16609.16 / 18921.73 |
|
Last:
18534.80
|
|
Three Months |
+2656.29
(+16.73%)
|
15899.72 / 18921.73 |
|
0.00
(0.00%)
|
|
52Weeks |
+3987.24
(+27.41%)
|
17418.59 / 23267.95 |
|
|
| |
|
HSI Commerce & Industry |
11494.04 |
0.00 |
0.00% |
7.874M |
0 |
|
| |
|
 |
|
Previous Close |
11494.04 |
|
Open |
0.00 |
|
Turnover |
0 |
|
| |
High |
0.00 |
|
Low |
0.00 |
|
Volume |
7.874M |
|
| |
One Month |
-1693.89
(-12.84%)
|
11079.58 / 13335.24 |
| |
Two Months |
-2057.13
(-15.18%)
|
12900.14 / 14449.19 |
|
Last:
11494.04
|
|
Three Months |
-1493.48
(-11.50%)
|
12773.03 / 14449.19 |
|
0.00
(0.00%)
|
|
52Weeks |
+2285.40
(+24.82%)
|
11079.58 / 16080.32 |
|
|
| |
|
S&P/HKEx GEM |
20.26 |
0.00 |
0.00% |
7.900M |
869.000K |
|
| |
|
 |
|
Previous Close |
20.26 |
|
Open |
0.00 |
|
Turnover |
869.000K |
|
| |
High |
0.00 |
|
Low |
0.00 |
|
Volume |
7.900M |
|
| |
One Month |
+3.24
(+19.04%)
|
18.78 / 20.20 |
| |
Two Months |
+2.67
(+15.18%)
|
16.71 / 18.82 |
|
Last:
20.26
|
|
Three Months |
+3.78
(+22.94%)
|
16.14 / 18.82 |
|
0.00
(0.00%)
|
|
52Weeks |
+5.79
(+40.01%)
|
16.76 / 22.09 |
|
|
| |
|
HSI Volatility Index |
23.77 |
0.00 |
0.00% |
0 |
0 |
|
| |
|
 |
|
Previous Close |
23.77 |
|
Open |
0.00 |
|
Turnover |
0 |
|
| |
High |
0.00 |
|
Low |
0.00 |
|
Volume |
0 |
|
| |
One Month |
+3.61
(+17.91%)
|
19.12 / 26.88 |
| |
Two Months |
+0.42
(+1.80%)
|
19.80 / 23.68 |
|
Last:
23.77
|
|
Three Months |
-3.63
(-13.25%)
|
19.80 / 28.89 |
|
0.00
(0.00%)
|
|
52Weeks |
-2.29
(-8.79%)
|
16.35 / 33.15 |
|
|